A few earlier projects in data and visualization, plus a book about lessons learned in business. These are the experiments that helped me learn by making something: asking a question, working through the data and finding a useful way to show the result.
The data projects below were created in 2020, before AI coding tools became widely available.
Data visualization
01 / Interactive map
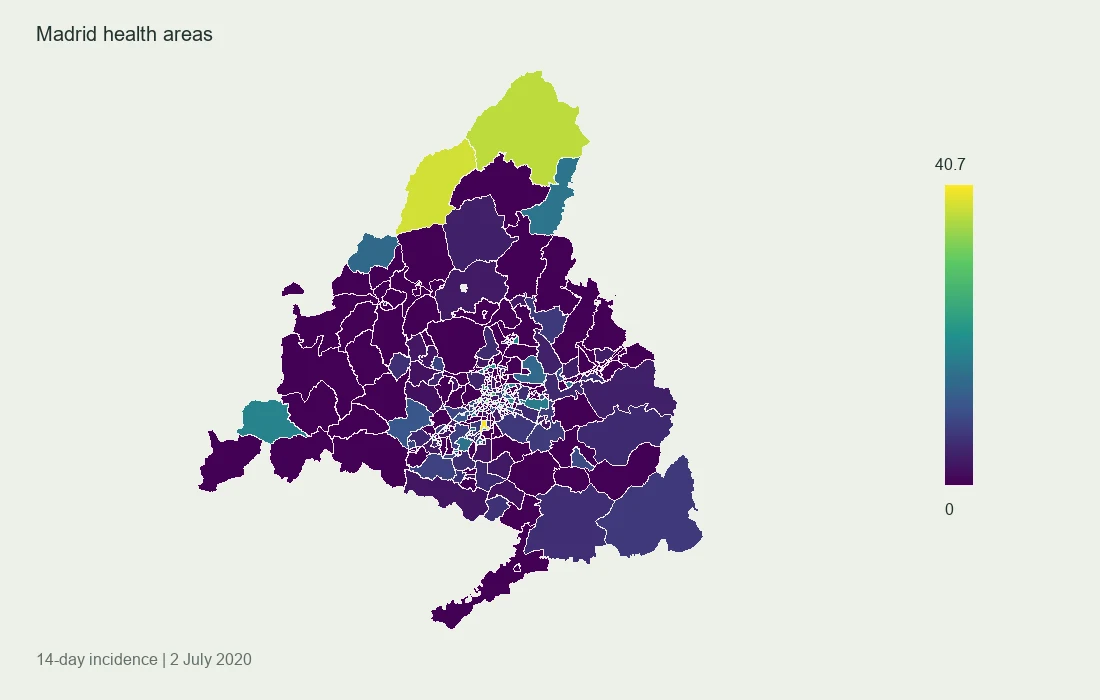
COVID-19 incidence across Madrid
An interactive map of reported incidence across Madrid’s health areas, using regional public data. I analyzed the data in R and built the map boundaries in QGIS before bringing the result into Plotly.
The original map shows the 14-day incidence recorded on 2 July 2020. It’s a historical snapshot, rather than a current health-data service.
Preview drawn from the original map data. Explore the interactive version for individual health areas.
The original interactive map is about 23 MB and loads only when opened.
02 / Animated visualization
Airport traffic, in motion
A bar-chart race built in Python from the TSA passenger-throughput dataset I assembled. The animation makes changes in airport traffic easier to follow and shows the disruption around the start of the pandemic.
The original animation, restored from the earlier portfolio. Use the player controls to play or pause it.
03 / Time-series analysis
Two borders. Different patterns.
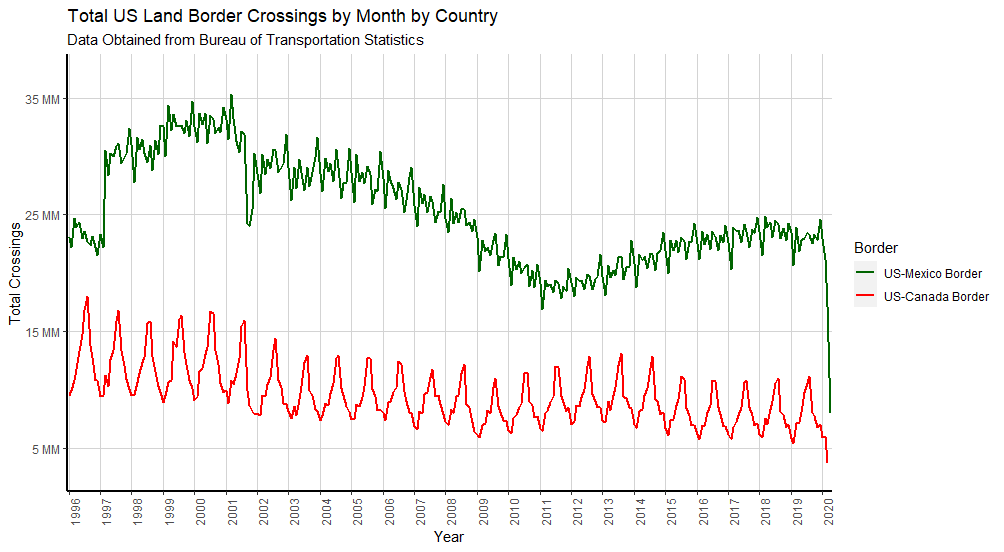
A long view of monthly crossings at the U.S.–Mexico and U.S.–Canada borders. The chart brings out the contrast in seasonal patterns and the sharp drop in crossings in 2020.
I worked with U.S. Bureau of Transportation Statistics data in R and used ggplot2 to present the two series together.
Original chart. Source: U.S. Bureau of Transportation Statistics.
Datasets
04 / Public data
Turning TSA PDFs into usable data
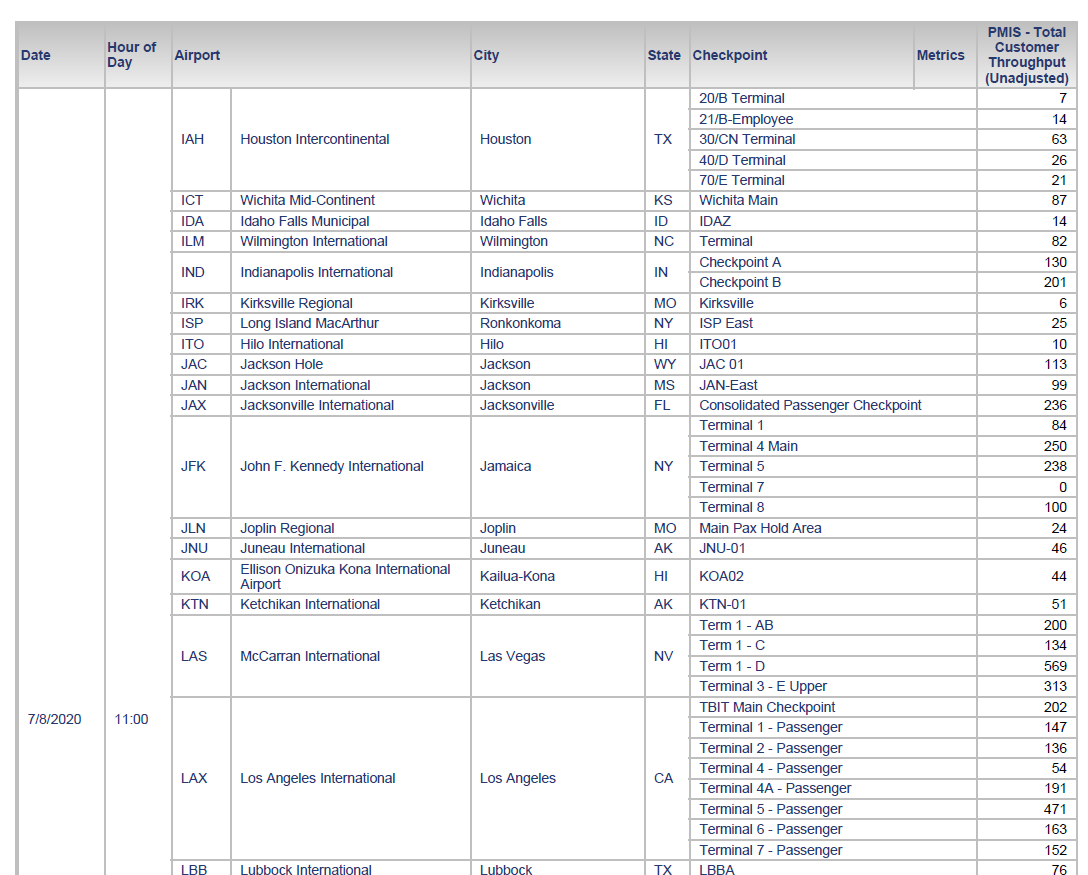
Airport- and checkpoint-level passenger counts were published in PDFs that were awkward to analyze. I used Tabula, Python and R to extract and clean those tables into structured data.
The archive contains approximately seven million rows as of July 2020. The repository documents its historical coverage and known gaps.
An example of the original PDF tables, before extraction and cleaning. Click to see the full image.
Writing
05 / Book
Why I Failed
13 Lessons You Can Learn From My Small Business Failure
I wrote about my experience of a small-business failure and the lessons it left me with. It’s another way of making something useful from what I’ve learned.