Portfolio
Here you can find an example of items created by Kevin to demonstrate knowledge and experience.
Data Visualization
Interactive Map of Covid-19 Incidence in Community of Madrid
This visualization was collected from data from the Community of Madrid and analyzed in R. Interactive plot created by Plotly for R. The shapefile for the map was created using publicly available data with QGIS as there was no easily available map in plotting libraries. The point of the visualization was to show how the rural, mountainous areas of Madrid were most affected by the resurgence of Covid-19 cases.
TSA Airport Data Bar Chart Race
This bar chart race was created from data using the TSA throughput database that I maintain. Data were manipulated using Python and the bar chart race was also created in Python. The data shows just how severe the impact of Covid-19 has been on air traffic in an innovative and intuitive way.
US Land Border Crossings
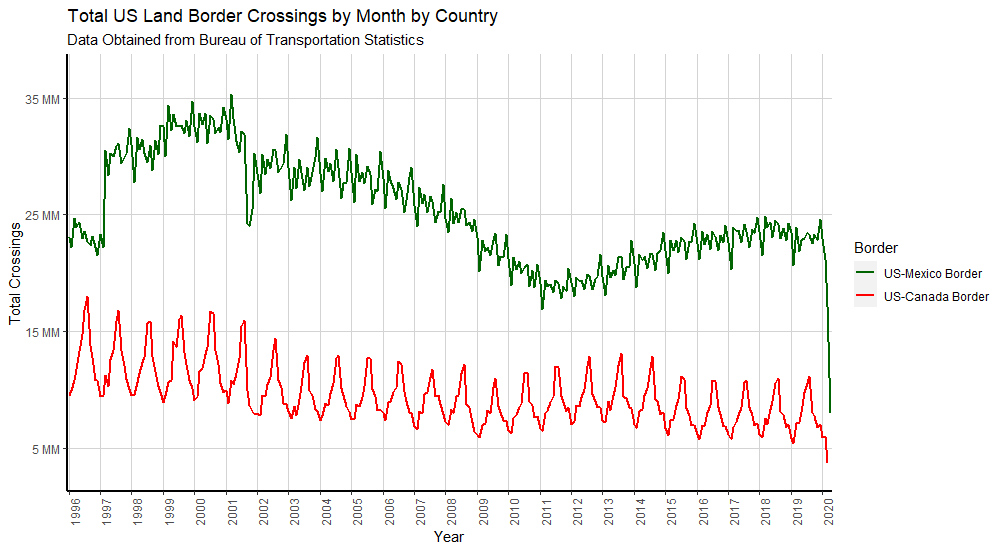
This graph is obtained from border crossing data from the the US Bureau of Transportation Statistics. The data was analyzed in R and plotted using the ggplot2 package to show interesting trends in border crossing between Mexico/Canada and the United States. The data clearly shows the impact of economic events such as trade deals or the Sept. 11 attacks on Mexican crossings and the extreme seasonality of crossings between Canada and the US. Additionally using the extended time frame on the x-axis is able to show just how sharply and deeply the Covid-19 pandemic has affected border crossings.
Datasets
US Transportation Security Administration Throughput Data
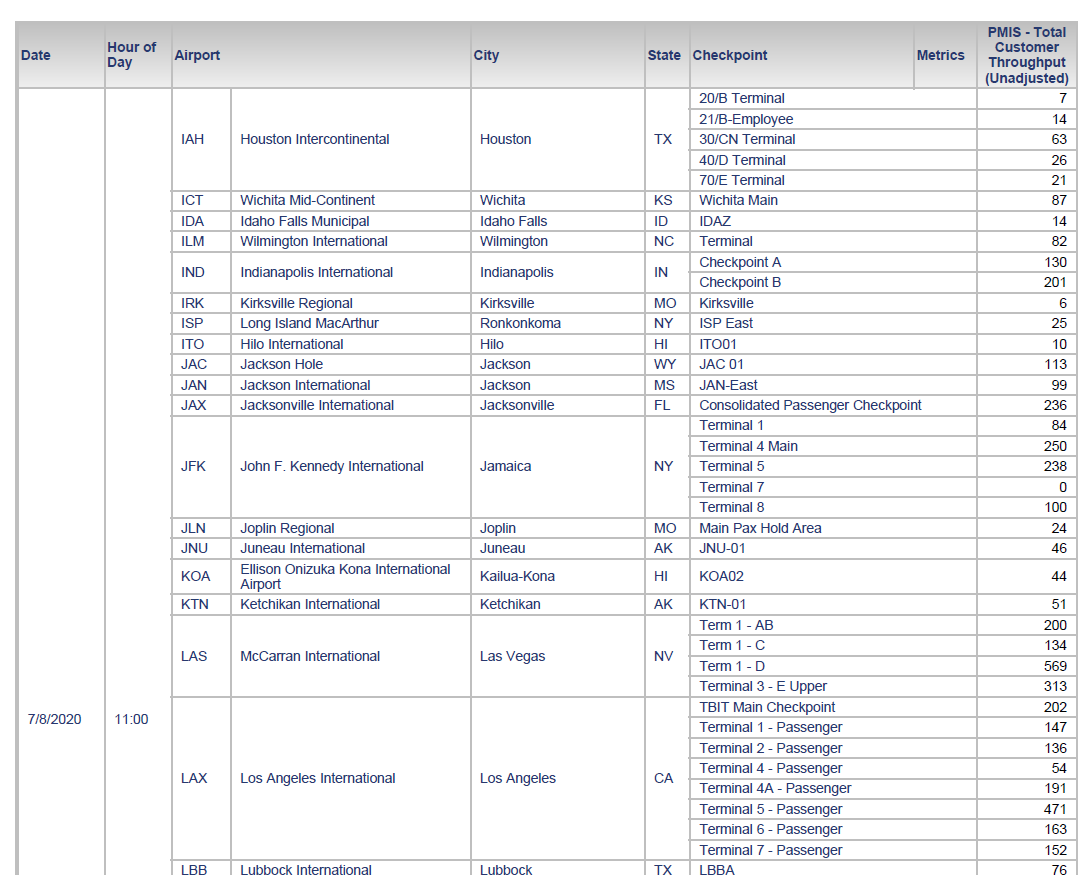 Example page from TSA Data
Data is provided for passenger throughput at security checkpoints operated by the United State Transportation security administration. (source) From these data, they are cleaned from the unweildy .pdf format to clean data that are easily queried in SQL, Python, R or other data analysis tools. There are currently approximately 7 million rows of data as of July 2020.
The publicly available data is made available here.
Web Development
Jammming Codecademy Capstone
This project involves a react website that interacts with the Spotify API in order to create and save a playlist. React elements include passing functions down multiple levels including calls to external APIs.